 0LKMgft04bZHzvskd6dIk
The main types of business analytics are descriptive, diagnostic, predictive, and prescriptive analytics. Together, these methods help organizations understand past performance, investigate causes, estimate future outcomes, and evaluate possible actions. Business analytics is most useful when these methods operate within a repeatable life cycle that begins with a business problem and ends with measured results.
The four-type model is useful, but it should not be treated as a rigid ladder in which every organization must progress from simple reporting to advanced artificial intelligence. If you need the broader foundation first, see what business analytics is and how it connects business data with practical decision-making.
Different decisions require different analytical methods. A monthly revenue review may need descriptive business data analysis. A sudden increase in customer cancellations may require diagnostic analysis. Demand planning may benefit from prediction, while a scheduling problem could require optimization.
The method should follow the decision rather than the other way around.
How Many Types of Business Analytics Are There?
Business analytics does not have one universally applied classification.
Many academic programs organize the field around three broad pillars: descriptive, predictive, and prescriptive analytics. Other frameworks explicitly separate diagnostic analytics from descriptive analysis.
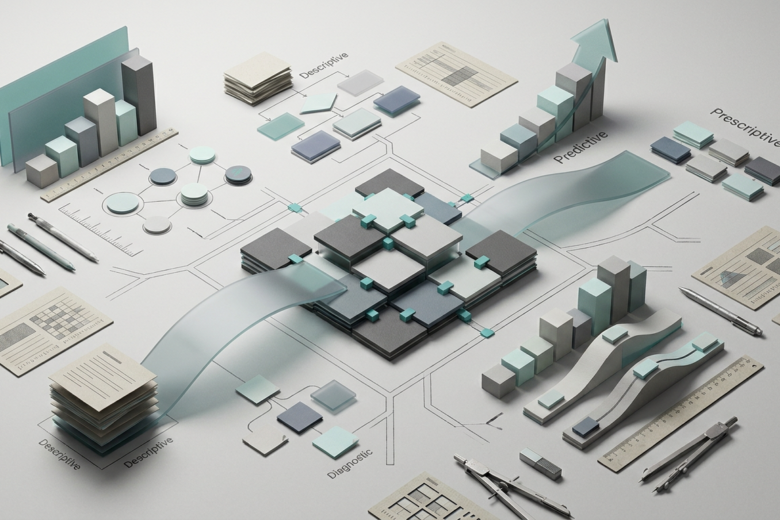
For practical business use, the four-part model is helpful because each category answers a different managerial question:
| Type of analytics | Core question | Typical output |
|---|---|---|
| Descriptive | What happened? | Metrics, summaries, trends |
| Diagnostic | Why did it happen? | Drivers, relationships, root-cause hypotheses |
| Predictive | What may happen next? | Forecasts, probabilities, classifications |
| Prescriptive | What action should we consider? | Recommendations, scenarios, optimized choices |
These categories overlap in real projects. One business problem may use all four.
1. Descriptive Analytics: Understanding What Happened
Descriptive analytics organizes historical and current data so decision-makers can understand performance.
Common outputs include:
- revenue reports;
- conversion rates;
- inventory levels;
- customer counts;
- operating costs;
- average order values;
- defect rates;
- delivery times;
- employee turnover;
- monthly KPI dashboards.
Descriptive analysis usually relies on aggregation, percentages, averages, distributions, segmentation, visualization, and comparisons across periods or groups.
Example of Descriptive Business Analytics
Suppose an online retailer reports the following quarterly results:
| Metric | Q1 | Q2 |
|---|---|---|
| Orders | 12,000 | 11,100 |
| Revenue | $840,000 | $821,400 |
| Average order value | $70 | $74 |
| Conversion rate | 3.4% | 2.9% |
Descriptive analytics reveals several facts.
Revenue declined. Order volume also declined. Average order value increased, while conversion decreased.
Those findings describe the situation, but they do not yet explain it.
That limitation is where diagnostic analysis becomes useful.
2. Diagnostic Analytics: Investigating Why It Happened
Diagnostic analytics examines possible reasons behind an observed result.
A business may use diagnostic analytics after descriptive analysis identifies an unusual change, exception, or trend.
Possible techniques include:
- segmentation;
- drill-down analysis;
- cohort comparisons;
- correlation analysis;
- variance analysis;
- process analysis;
- funnel analysis;
- anomaly investigation;
- root-cause analysis.
The objective is not merely to collect more detail. Diagnostic analytics attempts to identify relationships that may explain the observed outcome.
Returning to the retailer example, a conversion decline could be examined by:
- traffic source;
- device type;
- new versus returning visitors;
- geographic region;
- landing page;
- product availability;
- checkout step;
- promotional period.
Suppose mobile conversion dropped from 3.0% to 2.1% while desktop conversion remained nearly unchanged. Further analysis shows that the decline began immediately after a mobile checkout redesign.
That pattern provides a much stronger hypothesis than the original observation that total conversion fell.
Diagnostic Analytics Does Not Automatically Prove Cause
A common business analytics mistake is treating an observed relationship as proof of causation.
Two variables can move together without one causing the other.
For example, customer complaints may rise during periods of high sales. That does not necessarily mean higher sales directly create poor service. Both measures could be affected by insufficient staffing during peak periods.
Good diagnostic business data analysis distinguishes:
“These factors are associated”
from:
“This factor caused the outcome.”
The second claim normally requires stronger evidence.
3. Predictive Analytics: Estimating What May Happen
Predictive analytics uses historical data and quantitative relationships to estimate unknown or future outcomes.
Typical predictive applications include:
- sales forecasting;
- demand forecasting;
- churn prediction;
- credit-risk estimation;
- fraud detection;
- lead scoring;
- maintenance prediction;
- inventory planning;
- delivery-time estimation;
- customer-response modeling.
Predictive methods range from relatively simple regression and time-series models to more complex machine-learning approaches.
A Forecast Is Not a Fact
Suppose a business forecasts next month’s demand at 10,000 units.
The useful question is not:
“Will demand be exactly 10,000?”
A better decision question is:
“What range of demand is plausible, and what changes if actual demand falls outside that range?”
Predictive analytics deals with uncertainty. A forecast should therefore be interpreted together with model assumptions, uncertainty, data limitations, and business conditions.
An apparently precise prediction can create poor decisions when users treat an estimate as certainty.
4. Prescriptive Analytics: Evaluating What to Do
Prescriptive analytics evaluates possible actions under defined objectives and constraints.
Common prescriptive methods include:
- optimization;
- simulation;
- scenario analysis;
- decision models;
- resource allocation;
- scheduling;
- routing;
- what-if analysis.
A predictive model might estimate demand for several products.
Prescriptive analytics can go further by asking:
How should limited inventory capacity be allocated across those products?
The answer may depend on:
- expected demand;
- profit margin;
- storage capacity;
- supplier limits;
- service targets;
- stockout costs;
- minimum order quantities;
- cash constraints.
Prescriptive analytics is therefore not simply a more advanced prediction. It introduces a decision structure.
One Business Problem Can Use All Four Types
Consider a company experiencing an increase in customer churn.
Descriptive
The company measures churn and finds that the quarterly rate increased from 4.5% to 6.2%.
Diagnostic
Business data analysis shows that the increase is concentrated among customers who contacted support more than twice during their first 30 days.
Predictive
A model estimates the probability that each active customer will cancel during the next 60 days.
Prescriptive
The company compares retention actions and determines which customers should receive proactive support given limited staff capacity.
The project is not four unrelated analytics exercises.
Each method contributes to a single decision process.
The Business Analytics Life Cycle
The types of business analytics describe what kind of analytical question is being answered.
The business analytics life cycle describes how an analytical project moves from a business problem to an implemented result.
One widely used model is CRISP-DM, the Cross-Industry Standard Process for Data Mining. It organizes analytical work into six phases:
- business understanding;
- data understanding;
- data preparation;
- modeling;
- evaluation;
- deployment.
The process is iterative rather than strictly linear. New discoveries can send a team back to an earlier phase.
That structure is particularly useful for analytics for business because new findings frequently expose problems with the original question, available data, assumptions, or proposed model.
Phase 1: Business Understanding
The project begins by defining the business problem.
This phase should answer questions such as:
- What decision needs improvement?
- Who owns the decision?
- What outcome matters?
- What constraints apply?
- How will success be measured?
- What would make the analysis economically worthwhile?
The first phase prevents a common failure: starting with a dataset or technology and searching for a business use later.
Business value should determine analytical requirements rather than available data determining what the business pretends to need.
Phase 2: Data Understanding
Once the problem is defined, analysts investigate available data.
The work may include:
- identifying data sources;
- reviewing fields and definitions;
- checking sample sizes;
- exploring distributions;
- looking for missing values;
- identifying outliers;
- comparing time periods;
- assessing data quality.
A useful question during this stage is:
Does the available data actually represent the business problem?
A large dataset can still be inadequate if the variables needed to answer the decision are missing.
Phase 3: Data Preparation
Raw operational data is rarely ready for analysis.
Preparation may require:
- correcting errors;
- combining sources;
- creating consistent definitions;
- handling missing values;
- removing duplicates;
- transforming variables;
- creating derived measures;
- selecting relevant observations;
- restructuring data for analysis.
This stage is easy to underestimate because the final output is less visible than a dashboard or model.
Yet poor preparation can invalidate everything that follows.
If two systems define an “active customer” differently, combining their records without resolving that definition can produce misleading metrics even when every calculation is technically correct.
Phase 4: Modeling and Analysis
The analytical team now selects methods appropriate to the question.
Depending on the project, the work could involve:
- descriptive summaries;
- segmentation;
- regression;
- forecasting;
- classification;
- clustering;
- simulation;
- optimization.
The model should be no more complicated than the decision requires.
A straightforward calculation with transparent assumptions can be more valuable than a sophisticated algorithm that stakeholders cannot validate or use.
Phase 5: Evaluation
Analysts then assess whether the result works for the business problem.
Technical accuracy is only part of that evaluation.
The business should also ask:
- Does the result answer the original question?
- Are the assumptions reasonable?
- Is the output understandable?
- Does the model perform well enough for the decision?
- Are important groups or conditions missing?
- Could using the result create unintended consequences?
- Is implementation economically justified?
Some decision problems do not benefit sufficiently from advanced analytics because data may be insufficient, unreliable, or the analytical effort may not be cost-effective.
The existence of available analytics technology is therefore not proof that it should be used.
Phase 6: Deployment and Measurement
Deployment means putting analytical output into real use.
Possible implementations include:
- a management dashboard;
- a recurring report;
- a forecasting process;
- an automated alert;
- a scoring system;
- a scheduling rule;
- an optimization recommendation;
- a workflow change.
Deployment is not the true end of the business analytics life cycle.
The organization should measure what happened after implementation.
A forecast should be compared with actual results. A new decision rule should be evaluated against the old process. Model performance should be monitored as business conditions change.
That feedback creates the next analytical cycle.
A Better Way to Think About the Analytics Life Cycle
The life cycle is often drawn as a neat sequence.
Real business analytics is less tidy.
A team may discover during data preparation that a required variable does not exist. That discovery may force the team back to business understanding and require a narrower objective.
Evaluation may reveal that a highly accurate predictive model is too difficult to deploy. The project may return to modeling and select a simpler method.
New business conditions may invalidate an existing model and require another data-understanding phase.
Iteration is normal, not evidence that the analytical process failed.
Business Intelligence and Analytics: What Is the Relationship?
Business intelligence and analytics are closely related concepts.
There is no universally clean boundary between them.
For practical purposes, however, a distinction can still be useful.
| Capability | Business Intelligence | Business Analytics |
|---|---|---|
| Reporting historical performance | Strong emphasis | Used |
| Dashboards and monitoring | Strong emphasis | Used |
| Data integration | Core infrastructure role | Depends on infrastructure |
| Diagnostic investigation | Possible | Strong emphasis |
| Forecasting | Sometimes | Common |
| Optimization | Less central traditionally | Common advanced use |
| Decision modeling | Limited in basic BI | Stronger emphasis |
| Main practical question | What is happening? | What does the evidence mean for the decision? |
Modern tools increasingly blur these boundaries.
A single platform may provide dashboards, forecasting, machine learning, natural-language queries, alerts, and optimization-related features.
That is why arguing over whether a particular dashboard is “BI” or “analytics” is often less useful than asking what decision the system supports.
Business Intelligence and Data Analytics Work Best Together
Business intelligence can provide the information foundation for deeper analytics.
Consider a retailer.
A BI environment may consolidate:
- sales;
- inventory;
- customer records;
- store performance;
- product data.
Managers can then monitor those measures through reports and dashboards.
The same underlying information can also support deeper analytics:
- investigate why a region is underperforming;
- forecast demand;
- estimate churn risk;
- test pricing scenarios;
- optimize replenishment.
Together, business intelligence and data analytics often form different parts of the same decision system.
Business Growth Analytics
Business growth analytics applies analytical methods specifically to growth decisions.
Possible questions include:
- Which customer segments are growing fastest?
- Where does customer acquisition generate durable value?
- Which products create repeat purchases?
- Which geographic markets show sustainable demand?
- Does increased marketing spend continue to produce incremental revenue?
- Which capacity constraint will limit future growth?
Growth analysis should not focus on a single positive metric.
Revenue can rise while acquisition costs rise faster. Customer counts can increase while retention deteriorates. New locations can add sales while reducing overall return on invested capital.
A useful business growth analytics process therefore combines growth indicators with efficiency, profitability, retention, capacity, and risk measures.
The Analytics Maturity Ladder Is Often Misunderstood
Business analytics is sometimes presented as a simple maturity ladder:
descriptive → diagnostic → predictive → prescriptive
The implication is that prescriptive analytics is automatically superior.
That view is too simplistic.
A reliable descriptive metric can be more valuable than a weak predictive model. Diagnostic analysis may solve a recurring operational problem without requiring machine learning. Prescriptive optimization may be inappropriate when objectives cannot be defined clearly or when important constraints are missing from the data.
Practical Note: Analytical maturity is better measured by whether an organization consistently matches the right method to the right decision than by how advanced its software appears.
Common Mistakes When Selecting an Analytics Method
Using Predictive Analytics for a Descriptive Problem
A company wants to understand last quarter’s performance but immediately proposes machine learning.
A well-designed report and variance analysis may answer the question more clearly and cheaply.
Treating Diagnostic Analysis as Proof of Causation
A correlation appears between two business measures, and management assumes one caused the other.
Diagnostic findings should generate and test explanations, not create unsupported certainty.
Building a Forecast Without a Decision
A forecasting model may be statistically accurate but operationally useless if nobody has defined what action changes when the forecast changes.
Optimizing the Wrong Objective
Prescriptive analytics can produce mathematically optimal recommendations for a poorly chosen target.
For example, minimizing delivery cost without a service-level constraint could produce unacceptable customer outcomes.
Skipping Deployment
Teams sometimes treat model completion as project completion.
An analysis that never enters a workflow, report, policy, or decision process creates little operational value.
Ignoring Feedback
Business conditions change.
A model that performed well last year may weaken after pricing changes, new customer behavior, economic shifts, new competitors, or altered business processes.
A Decision Framework for Selecting the Right Type
Instead of asking which type of analytics is “best,” start with the uncertainty in the decision.
| If you need to know… | Start with… |
|---|---|
| What changed | Descriptive analytics |
| Where the change occurred | Descriptive + diagnostic |
| What may explain the change | Diagnostic analytics |
| What is likely to happen | Predictive analytics |
| Which action best meets defined objectives | Prescriptive analytics |
| Whether an action worked | Descriptive + diagnostic |
| Whether a model remains useful | Evaluation and monitoring |
Complex decisions may move through several rows.
The objective is not to reach prescriptive analytics as quickly as possible.
The objective is to reduce the uncertainty that matters for the decision.
Key Takeaways
- Business analytics is commonly organized into descriptive, predictive, and prescriptive analytics, while many practical frameworks also treat diagnostic analytics as a separate type.
- Descriptive analytics explains what happened.
- Diagnostic analytics investigates why an outcome may have occurred.
- Predictive analytics estimates future or unknown outcomes.
- Prescriptive analytics evaluates possible actions under objectives and constraints.
- One business problem can use several types of analytics.
- A business analytics life cycle should begin with the business problem rather than the available technology.
- A practical analytics life cycle covers business understanding, data understanding, preparation, modeling, evaluation, deployment, and ongoing measurement.
- Business intelligence and analytics overlap substantially and increasingly operate as parts of the same data-driven decision environment.
- Advanced analytics is not automatically better; the appropriate method depends on business value, data readiness, uncertainty, cost, and the decision being made.
Frequently Asked Questions
What are the four types of business analytics?
The four commonly discussed types of business analytics are descriptive, diagnostic, predictive, and prescriptive analytics. Descriptive analytics summarizes what happened, diagnostic analytics investigates possible causes, predictive analytics estimates future outcomes, and prescriptive analytics evaluates possible actions. Some academic frameworks combine diagnostic work with other categories and use a three-type model instead.
What is the business analytics life cycle?
The business analytics life cycle is the recurring process of defining a business problem, understanding and preparing relevant data, applying analytical methods, evaluating results, deploying useful outputs, and measuring outcomes. Analytical projects often move back and forth between phases as new information changes the original assumptions.
What is the difference between descriptive and diagnostic analytics?
Descriptive analytics identifies what happened by summarizing business data, while diagnostic analytics investigates why the observed result may have occurred. A sales report showing a revenue decline is descriptive; an analysis showing that the decline is concentrated in products affected by stockouts is diagnostic.
What is the difference between predictive and prescriptive analytics?
Predictive analytics estimates what is likely to happen, while prescriptive analytics evaluates what action should be considered. A demand forecast is predictive. A model that uses the forecast, storage limits, margins, and supplier constraints to recommend inventory quantities is prescriptive.
Is business intelligence the same as business analytics?
Business intelligence and business analytics overlap but are not always used identically. Business intelligence traditionally emphasizes data integration, reporting, dashboards, and performance monitoring, while business analytics often places greater emphasis on explanation, prediction, and decision modeling. Modern systems increasingly combine both sets of capabilities.
Which type of business analytics should a company start with?
A company should start with the analytical method required by the decision rather than automatically choosing the most advanced method. If the organization cannot reliably describe current performance, descriptive analytics may create more value than a complex predictive model. Data availability, decision value, cost, and feasibility should determine the approach.